
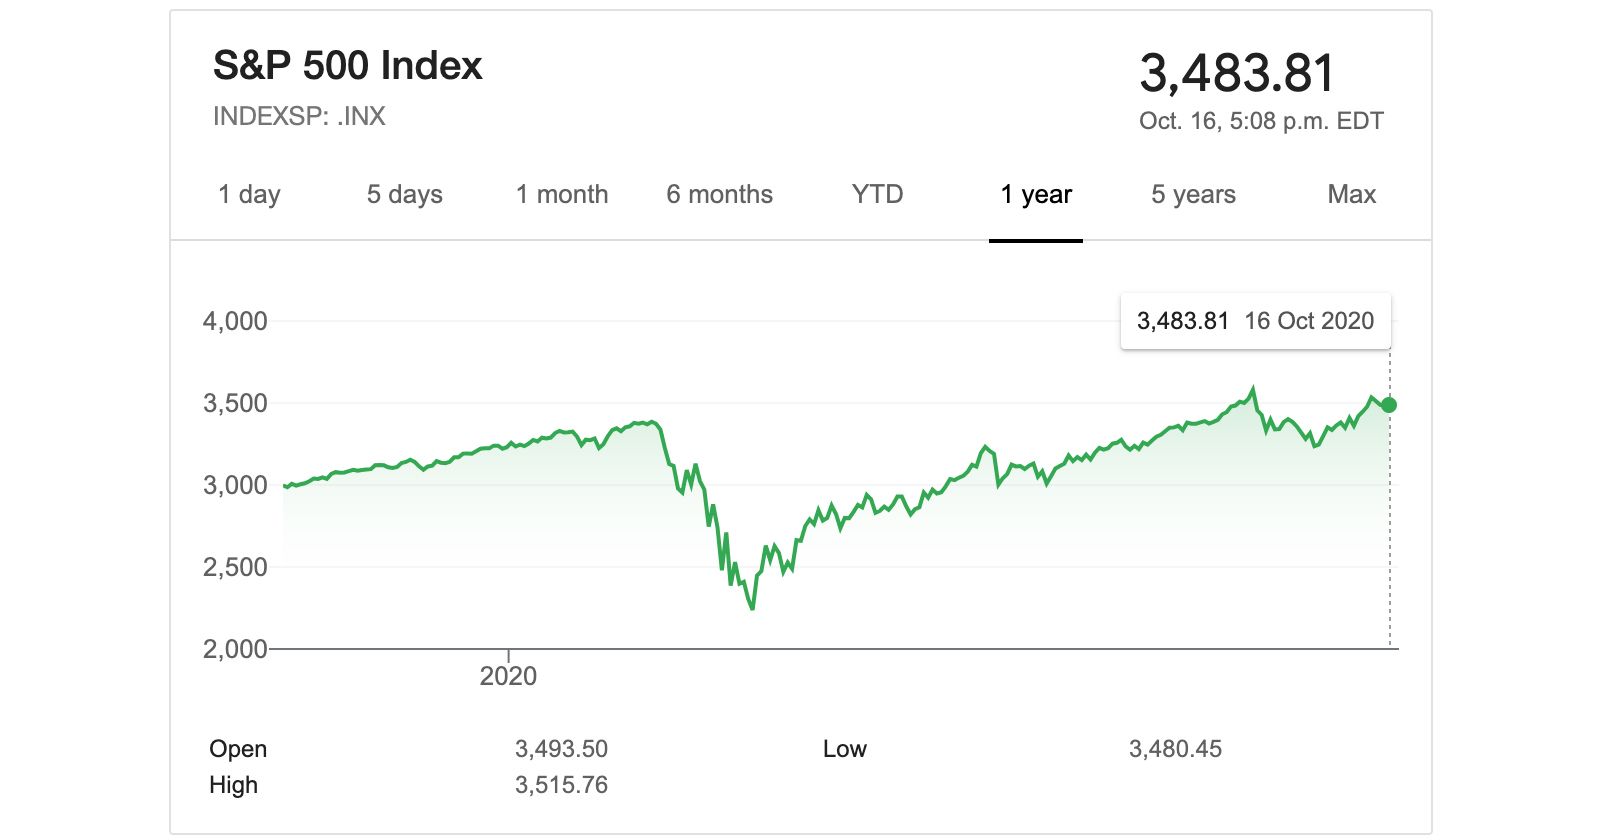
I published an article six months ago entitled "The Recession is Cancelled?" In it I shared my thoughts on investing during the COVID-19 pandemic. The fundamental ideas are still relevant today even though it was written at a time of extreme uncertainty. It is worth revisiting because we now understand much more about the virus and the response from markets. Major equity indices such as the S&P500 have recovered to pre-pandemic levels and there is confusion as to whether this indicates overall economic recovery (spoiler: it does not). The question people are having trouble answering is: "Why?"
To briefly summarize, there were three key take-aways from my original article:
- Skepticism of investment experts should be at an all time high. I suggested looking at the effects of the pandemic as well as economic indicators then estimating the response from both policy makers and markets.
- Hedging and diversification is key. Timing the market is a bad idea but attempting to separate pandemic winner/loser stocks would give you an advantage.
- Lookout for new valuation methods. I was very interested to see how the market comes to a consensus on how to value financial assets and the impact policy makers would have.
Again, I think all of these still apply. However I do want to elaborate on the third point - specifically as it relates to government stimulus and financial asset values.
Reflation
"Reflation" (not to be confused with "inflation") is the growth of an economy by government stimulus, using either fiscal and/or monetary policy.
I previously explained the basics of these policies back in April. Without going into the details again, it is important to understand the intended outcome is always increased economic growth. Many struggle to see how execution of these policies leads to growth because it is not a direct cause-and-effect relationship. Policies may lead to spurred consumer spending or higher employment which then leads to growth. There are leading indicators for growth like interest rates, yield curves and financial asset prices but there are also as lagging indicators like GDP, inflation and employment numbers.
I also mentioned that these policies were and are continuing to be used at unprecedented levels - especially monetary policy. Building on this, it is useful to take an ongoing look at how these policies are affecting the investing environment.
Central banks
Traditionally, central banks put money on deposit. Banks come along and then borrow that money and lend it to those who they expect will pay it back. That money then passes through the credit system - all financial assets compete with each other and it spreads out. Central banks monitor this environment and then slightly loosen or tighten as needed.
Today, central banks are much more involved in trying to "jumpstart" the economy as opposed to gently tending to it. The purchases of financial assets and government securities by central banks (especially in the US) are the drivers of the market right now. These policy decisions are executed in coordination with central governments in attempt to increase productivity in the longer run.
The Economic pie
It can be argued that reflation from monetary policy in the short term is not genuine growth. It may provide the "jumpstart" but wealth cannot be created from producing debt and printing money alone. There needs to be a real increase in productivity leading to a bigger economic pie. Capitalism is great at increasing the size of the pie (artificially or otherwise) and dividing it efficiently but it's profit-seeking nature can make it a poor long-term divider of that pie.
The growth rate has always been higher for capital than it has been for wages. Similarly, there has also always been wealth gaps stemming from this. The interesting part is that you will not find a single economist that argues stronger growth comes from an environment with extreme wealth gaps.
Why is this relevant now?
This reflation environment can be confusing especially if you follow mainstream media. Having this broad understanding can help you make better investment decisions because many traditional views of markets are skewed or no longer apply right now. This information also serves as a warning that some of these policies are not sustainable or can have negative effects in the long term.
High equity prices (according to traditional metrics) seem to be a sign that the market is disconnected from reality and excessively driven by monetary policy. Equity indices such as the S&P500 are reaching all-time highs yet macroeconomic indicators are still weak - improving, but still weak. While it can be concerning, there is support and some possible explanations for these price levels. You will here people say equities are "overvalued" and I am here to tell you they are not. What's great about markets today is that they are very liquid. Unless you are in the middle of a panic, getting out of your positions is really easy before any unlikely correction.
Real economy vs Financial economy
It is important to understand that there's a real economy and then there's the financial economy. The real economy has the supply and demand of goods and services. The financial economy that has its supply and demand of money and credit. Using some basic theory, the price of a financial asset will equal the risk free return (which everyone knows is something close to zero) and a risk premium.
Risk free rates and risk premiums
We could start by looking at the risk free rate which represents the percentage that investors are getting for a risk-free return. Normally, this is a treasury bond with a rate of between 0-1% (depending on the country) or a high quality corporate bond at slightly more than 1%.
What will the premium be for equities then? The central bank has the capacity to put money in the system and the money competes for getting returns. The risk premium or the expected excess return for equities over cash could go from 4% to let's say 2%. Traditional equity valuations such as a PE ratio are just the inverse of that. By way of this example, you could make the PE go from 20-25 times up to 40-50 times.
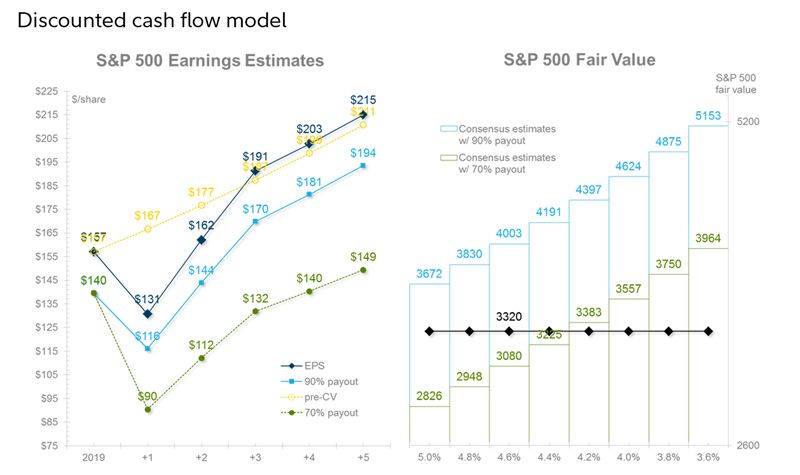
Assuming a range of risk premiums we can easily create a discounted cash flow model that supports the S&P500 at its current levels. That may seem implausible but it is no less implausible than zero interest rates to begin with. The risk premium will be driven by the amount of liquidity put into the system and therefore traditional metrics such as multiples become a less useful frame of reference.
The capital markets drive the economy (and the risk premiums) more than the real economy drives the capital markets.
Market microstructure
Looking at risk premiums is helpful but there are alternative and simpler explanations as to why prices of equities may increase in the absence of underlying performance. Market microstructure is the study of financial markets and how they operate. It has a fancy name but its just the study of how buying and selling on a market fundamentally works.
When more liquidity exists and capital flows to buy a particular financial asset - the buy volume increases. More buy volume usually increases prices. It is really that simple and can have nothing to do with whether a company is actually performing well or not.
An "order book" is the list of orders that an exchange uses to record the interest of buyers and sellers in a particular financial instrument. A matching engine uses the book to determine which orders can be fully or partially executed. It connects the buyers and sellers on the exchange.
Below is a visualization of an order book depth chart of a low volatility financial asset. The x-axis is the unit price, the y-axis is cumulative order depth. Bids (buyers) are on the left in green, asks (sellers) are on the right in red. The space between the buyers and the sellers is called the "spread" and the middle point is the quoted price.
The supply and demand for a particular stock and the mechanisms for trading can therefore affect the price. In the above example, you don't know which stock is being traded but you know that the price will increase if more buyers want it and are willing to slightly increase their bid to get it.
How far are central banks willing to go?
The consensus is that banks are willing to go and need to go as far as it takes in order to keep the system afloat. The alternative is a sinking ship. In absolute terms, this is the furthest monetary policy has ever been deployed. Because we're in this late stage, there is a lot of debt and central bank balance sheets are expanding.
Realistically, there are limits and they are extremely complex because they weave through the entire structure of society. Without attempting to identify the exact metrics, it seems to a be a mixture of maintaining the following (in order of importance)
- certain economic measures such as inflation to avoid devaluing currency
- political and geopolitical stability to avoid conflict
- social order and confidence to avoid civil unrest
What if equity prices declined in this environment or the economy does not recover in the longer term? Even the most prominent economists don't know exactly but it will likely be creative and unlike anything we've seen before. In a post-COVID environment, I'm hoping that stronger fiscal policy is experimented with a little bit more.
I've had a running joke over the past few months which involves me throwing macroeconomics books in the trash. Many need to be rewritten to factor in the past decade. While it may be interesting to study, this is the world we live in right now and this short period can have a lasting effect on our financial futures.
Disclaimer: This article is opinion and is for information purposes only. It is not intended to be and should not be considered as investment advice. Seek a duly licensed professional for investment advice. Opinions are my own and not the views of my employer.